Pivot Charts
A pivot chart is an interactive graphical representation of the data in a pivot table. This feature was introduced in Excel 2000.
Using a pivot chart makes it even easier to understand your data especially since the pivot table creates your subtotals and totals for you automatically.
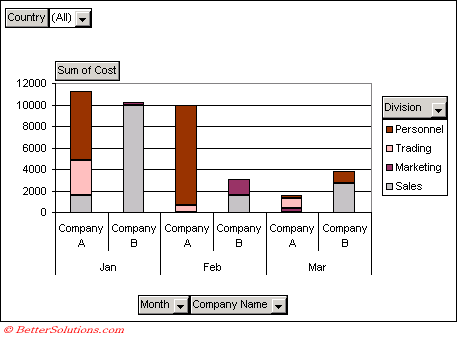 |
Page Fields - These are displayed in the top left corner of the chart.
Row Fields - These are displayed as the Category Axis.
Column Fields - These are displayed as the Value Axis.
PivotChart Tabs
These tabs are exactly the same as the one displayed for regular charts.
Creating a PivotChart
There are a number of ways to create a PivotChart:
1) When you create the PivotTable, by choosing PivotChart on Step 1 of the Wizard.
2) Pressing the PivotChart button on the PivotTable toolbar.
3) Using the Shortcut menu.
Adjusting your Pivot Chart
You can rearrange a pivot chart exactly the same as you would a pivot table by dragging the fields.
When you rearrange the fields using the chart the corresponding pivot table will also change (and visa versa).
You can use the PivotTable Field List to add and remove fields from a pivot chart as well.
If you create a pivot chart from a pivot table and then delete the pivot table, the chart becomes a normal chart and the data is transferred to arrays ??
The following elements, axes titles, chart title, legend, value axis, display unit labels cannot be moved or resized in Excel 2000.
Differences between a Normal Chart
There are a number of differences between pivot charts and regular charts
The most obvious difference is that pivot charts contain field buttons. These can be used to change the layout of the chart.
Important
A pivot chart is linked to the pivot table and always displays the same data as the pivot table.
You can remove the fields from a pivot chart by selecting a Field and selecting (Hide PivotChart Field Buttons).
Be careful when adding new series to existing charts to always ensure that the Category Labels exist / are copied over to your new series formula.
To paste a picture of a chart into another application, select the object, and then hold down Shift while selecting (Edit > Copy).
To copy a chart as picture you must copy the chart object as opposed to the chart - hold down Ctrl when selecting the chart to be copied. You can do a Paste special and then as picture.
© 2026 Better Solutions Limited. All Rights Reserved. © 2026 Better Solutions Limited TopPrevNext