US Treasury Spot Curve
You can create a treasury spot curve by using the yields from treasury bonds.
Also known as Risk Free Zero Coupon Curve, Spot Rate Yield Curve, Implied Zero Coupon Curve
This curve shows the yield to maturity of zero-coupon treasury securities.
US Treasury STRIPS
The yields on coupon strips are by definition zero coupon rates.
on the run
coupon paying treasury bonds
Could use UK government bonds
If US Treasuries are used, the curve is often called the Treasury Spot Curve
This the relationship between the yield to maturity on a zero coupon bond and the bonds maturity date.
Only zero-coupon bonds have no reinvestment risk associated with them.
It is the reinvestment risk (or assumption) that makes this curve a better choice than the Yield to Maturity curve.
Zero-coupon yields are the key determinant of value in the capital markets and they are calculated and quoted for every major currency.
Zero coupon yields can be used to value any cash flow that occurs at a future date.
Constructing the Curve using Coupon Paying Bonds
How do we construct the zero-coupon yield curve from coupon paying bonds.
When we use zero coupon bonds to construct our Discount Curve, the curve is often called the Zero Rate Curve.
We can do this using a process called Bootstrapping
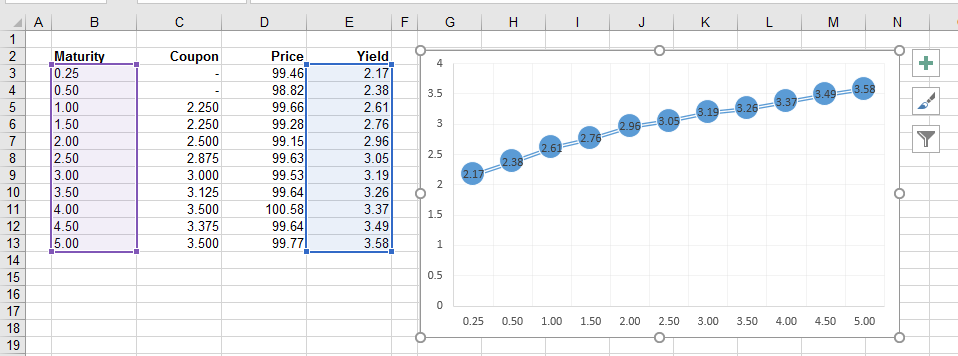
Lets suppose that we have the following US Treasury Bills and Notes
The chart shows these yields plotted against their maturity dates.
 |
1 Year Spot Rate
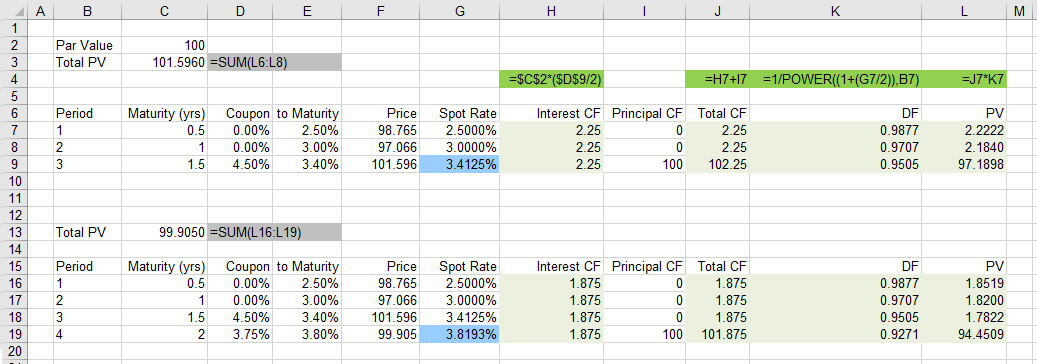
We already know the 0.25 and 0.5 spot rates since these Treasury Bills are already zero-coupon bonds.
So lets calculate what the 1 year spot rate would be.
We can calculate this using a method called bootstrapping.
1.5 Year Spot Rate
 |
The yield on a zero-coupon intrument is called the spot rate.
The zero-coupon yield curve is not an accurate indicator of average market yields because most bonds are not zero-coupon.
Yield Curve
Also known as Yield to Maturity Curve, bond yield curve, coupon curve, redemption yield curve, coupon bearing yield curve
You can take any type (or class) of bond and plot the yield to maturity for different maturity dates.
Treasury Yield Curve
When people talk about the Yield Curve they usually mean the Treasury Yield Curve.
The treasury yield curve shows the relationship between the treasury securities (bills and bonds paying coupons) and maturity
The yield curve is the term structure of interest rates and is defined as the relationship between the maturity of a zero-coupon bond and the yield to maturity.
A yield curve is a plot depicting yield as a function of time to maturity.
The most important usage for the yield curve is to evaluate the bond market.
This is the relationship between the discount rate and the days to maturity (time)
The yield to maturity for a bond is used to indicate the total return from the bond when held to maturity.
This is the curve that most people are referring to when they talk about yield curves.
This curve consists of the points "yield" vs "maturity" (at whatever price it is quoted, there is only one current price).
Creating
This can be constructed by taking one class of bond (for example US Treasuries) and plotting the calculated yield to maturity for different maturity dates.
Visit the following website to see the latest yield to maturities for all the currently listed treasury securities
link - marketwatch.com/market-data/rates?mod=market-data-center
Assumption
A big assumption is that it assumes that all the coupons are re-invested immediately at the coupon rate.
Obviously market rates will change over time so being able to re-invest at exactly this rate is unlikely.
This assumption creates reinvestment risk
Only bonds from the same class of issuer (and liquidity) are used
Everything is the same except the maturity dates.
The YTM of a coupon paying bond is a weighted average calculation of the zero-coupon rates up to maturity.
The later the coupon the more the weight is placed on it.
Important
The yield to maturity calculation assumes a flat yield curve.
Curves are normally plotted against whole years although the bonds used will rarely have an exact number of years to maturity.
On Bloomberg this is screen IYC
© 2025 Better Solutions Limited. All Rights Reserved. © 2025 Better Solutions Limited TopPrevNext