Range Indicator
Also known as the Chart Range Finder.
When you activate a chart the source data will be automatically highlighted when the data range is not too complex.
This method can only be used with embedded charts when the chart is on the same worksheet as the data ?
When the chart area is selected its source data will be highlighted.
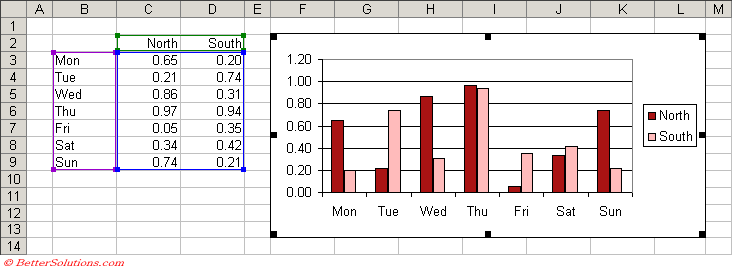 |
When an individual series is selected its source data will be highlighted.
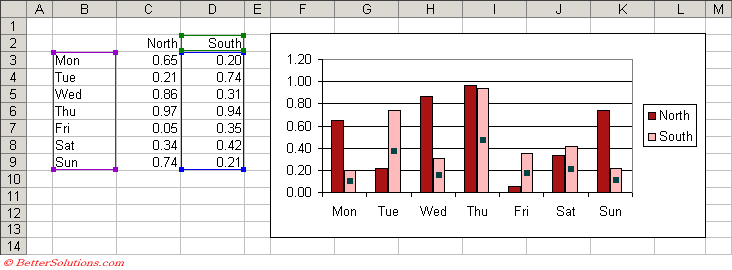 |
If you select the chart, instead of a series all the series are outlined in one colour and the series labels in another.
If you select a series, the series is in one colour and the series category labels are in a different colour.
When you edit a series formula, the cells and ranges that the formula refers to is outlined in one colour and the series category labels in a different colour.
Selecting an individual data series will highlight only the source data for that specific series.
The range of cells consists of one or more coloured ranges.
Purple - Series labels (X-axis) or categories
Blue - Values (Y-axis)
Green - Bubble Sizes / Series name, Legend details
Each outline has a handle (i.e. a small square in the bottom right corner) and the source data can be increased or decreased by dragging this handle.
Each of the highlighted ranges contains a small handle in each corner which can be easily dragged to expand or reduce the range used for the source data.
The source data can even be moved by selecting the edge and dragging the outline.
It is possible to extend the range of cells within your source data and see the chart updated immediately including the new data.
Changing values are reflected immediately.
Note that the data for an individual data series must be continuous. The colour cannot be changed.
You can alternatively just drag the source range indicators and fill handles.
A way to update your charts (i.e. re-link / assign the source data) without to press F9 which updates the whole worksheet
You can extend the ranges by placing your mouse at the corner of the data range. You should see the pointer turn into a small plus sign, press down and drag the mouse until the coloured border extends to include the new cells. Release the mouse and the chart will update.
Use the handles to drag expand or contract the range
Drag the whole range to different cells
Only works with embedded charts, not chart sheets
Changing the Source Data
It is also possible to use the Automatic Range Indicator to adjust the data ranges.
Marching ants border around the cell range(s).
This method is often the quickest and easiest.
It is possible to adjust the whole range or just an individual series by dragging the broder or the square in the bottom right corner.
You can even drag one of the sides to move the whole data block in one go.
For more information about the automatic range finders, please refer to the previous page.
Excel 2007 Changes
You can no longer drag a range of cells onto a chart to include more series. Instead you can copy the cell range and paste onto the chart.
You can no longer drag individual data points to automatically change the source date.
Legend - any series that does not have a name will appear in the legend as "series1", "series2" etc
2007 - blank rows when you have a date x-axis - seems to default to the first date on the axes (and not even zero).
© 2026 Better Solutions Limited. All Rights Reserved. © 2026 Better Solutions Limited TopPrevNext