Creating
F11 - Creates a chart on a chart sheet using the highlighted cells. Defaults to the chart you have chosen to be the default (ignoring workbook theme)
Alt + F1 - Creates an embedded chart on the active worksheet using the highlighted cells. Defaults to the chart you have chose to be the default (ignoring workbook theme)
(Insert tab, Charts Group) - Create an embedded chart on the active worksheet using the highlighted cells. Defaults to using the theme currently attached to the workbook, Chart Style 2. If the theme is changed the colours on this chart will also change.
(Insert tab, Other Charts > All Chart Types > Templates) -
Changing Defaut Chart
(Chart Tools, Design tab)(Change Chart type)
(Insert tab)(Other Charts > All Chart Types > Templates)
Manage Templates
C:\Documents and Settings\"---"\Application Data\Microsoft\Templates\Charts\
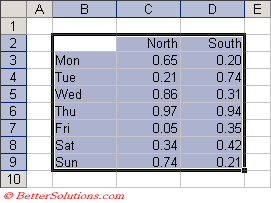
Select the cells containing the data you want to chart. This should include any row and column headings.
When creating a chart from a range of cells on a worksheet you do not need to highlight the whole range.
Excel will automatically highlight the current region around the active cell up to and excluding any blank rows and columns that surround.
 |
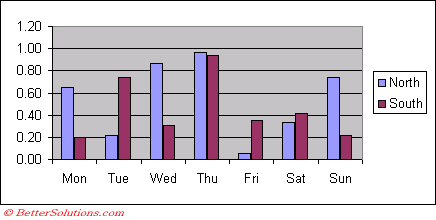
The quickest way to create a chart is to press (F11) once the source data is highlighted.
This will create a chart using the default chart type which is a clustered column chart.
The chart will be created on a separate chart sheet as opposed to embedded in the active worksheet.
When you create a chart the source data will actually be linked to the chart object which means the chart will be updated automatically whenever the data changes.
 |
After you have created a chart you can easily change the chart type, source data and formatting.
Excel provides a chart wizard which allows you to change the chart type, source data, chart options and location of your chart before it is actually created.
The quickest way to create a chart in Excel is to highlight the cells containing the labels and the data series and pressing F11.
The labels for the chart could be text or numbers.
For example years
Lets consider creating a chart using the following range of cells
SS
This will create a chart with 3 data series
Year | London | New York
Excel assumes that any numerical data that has a text column heading is a data series
You could always manually change the source data afterwards
Try removing the column headings above the category labels
Recommended Charts
This was originally called Chart Advisor and was introduced in Excel 2007.
Your selected data is analysed and based on a series of rules a list of chart types are chosen for your data
SS on Ribbon button
SS dialog box
3D charts will never be recommended
Each recommended chart type includes a live preview of how your data will look.
If your data contains repeating values such as categories then a pivotchart will be recommeded instead of a regular chart.
Selecting
If you have an embedded chart then you can easily select the chart.
There are two ways you can move an embedded chart:
1) By seleting the Chart Area.
2) By selecting the Chart Object.
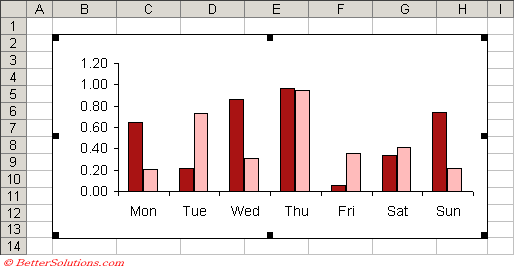
Selecting the Chart Area
The chart is activated.
 |
Selecting the Chart Object
To select the chart as an object, hold down the Ctrl key while selecting the chart with the left mouse button.
The chart is selected.
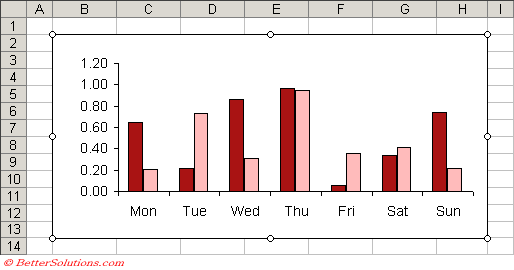 |
A selected chart displays a black border.
To select a chart move the mouse anywhere over the chart and press the left mouse button.
You can deselect a chart by selecting any cell, with the left or right mouse button.
Naming a Chart
You can use the arrow button on the Drawing toolbar to select a chart and then type the name in the Name Box.
Remember
You obviously cannot move a chart item to a location outside of the chart area.
When a chart is selected it has a black border with black handles
A chart is just an object that is placed in the drawing layer of the worksheet.
Deleting
The easiest way to just to select the chart object and press the Delete key.
If you ever have charts (or objects) on a worksheet that you can't actually see the easiest way to find them is to select an object (by holding down Ctrl and selecting) and tab through all the different objects on the worksheet.
If the chart is on a separate chart sheet you can delete the sheet as you would delete a normal worksheet.
Just select the chart sheet tab , press the right mouse button and select Delete.
Copying
Copying Charts
Excel at 100%, Word at 100%
Change the size to height 6cm, width 12cm Select the chart and press (Ctrl + C) or the Copy button
Switch to Word and Press (Ctrl + V) or press the large Paste button
The chart will be copied in with exactly the same height and width.
This can be seen from the Format tab The Paste Special smart tag will appear next to the chart by default.
SS
Use Destination Theme & Embed Workbook -
Keep Source Formatting & Embed Workbook -
Use Destination Theme & Link Data (default with Ctrl + V) -
Keep Source Formatting & Link Data Picture -
Always copy the charts as chart object (black handles) and not as general objects (white handles).
To copy a chart to the clipboard, right click the chart object (black handles) and select copy.
You can make an exact copy of an existing chart by holding down the Ctrl key, selecting the chart and dragging it with the mouse.
If your chart exists on a chart sheet then you need to copy the whole sheet.
For more information about copying sheets, please refer to the Copying Sheets page.
2007
Copying chart into Word as an EMF results in the chart being the wrong width
Best to paste it as a "windows metafile"
Copying Cells
Moving
If you have an embedded chart then you can easily move the chart to a different location on the worksheet.
There are two ways you can move an embedded chart:
1) By seleting the Chart Area and dragging.
2) By selecting the Chart Object and dragging.
Moving the Chart Area
Select the chart area by clicking in the blank area near to one of the four corners.
Eight small black handles will appear inside the perimeter of the chart area when the chart area is selected.
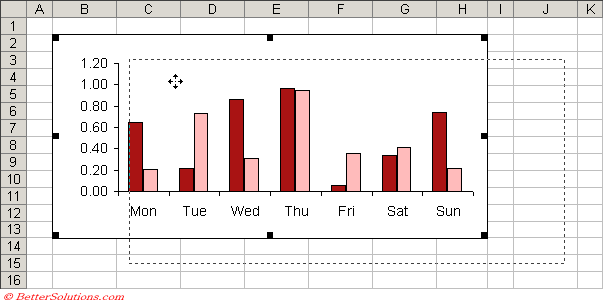 |
Select the chart border and drag the chart
To move the chart press the left button so the cursor changes to four arrows. While holding down the left mouse button drag the mouse until the chart is in the required position.
Once the outline is in the desired location, release the left mouse button to drop the chart at the new location.
Moving the Chart Object
Hold down the mouse button and drag the chart to the desired position.
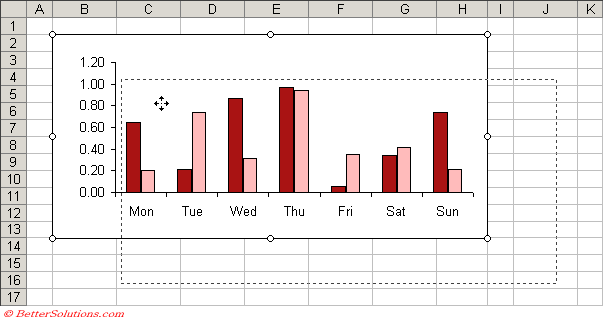 |
You can also set the picture to "Don't move or size with Cells". Select the object, format object - then properties
Remember
When dragging charts (or objects) on a worksheet, hold down the Alt key whilst dragging and the chart (or object) will snap to a cell, for easy aligning.
If you hold down the Shift key when dragging a chart it can be moved parallel to either the column or row headers.
If you hold down the Alt key when dragging a chart it will be aligned with the cell borders.
Resizing
There are two ways you can move an embedded chart:
1) By selecting the Chart Area and dragging.
2) By selecting the Chart Object and dragging.
Resizing the Chart Area
To size an object in an chart, you must first select the chart.
If the chart is an embedded chart you just need to select the chart area and use one of the 8 black fill handles to resize the chart
You can resize a chart by dragging any of the 8 black handles. The handles are the black squares along the outside of the chart.
To resize a chart, select the chart object format / object and alter the height and width accordingly on the size tab.
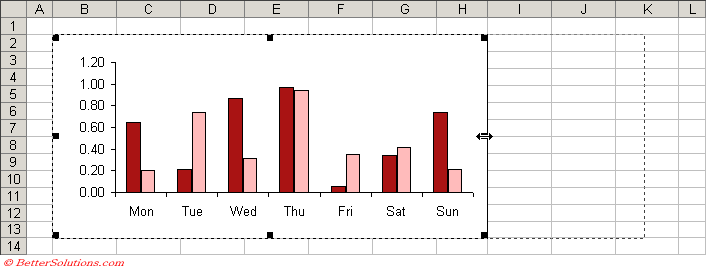 |
The mouse cursor will change when you hover over one of the eight handles.
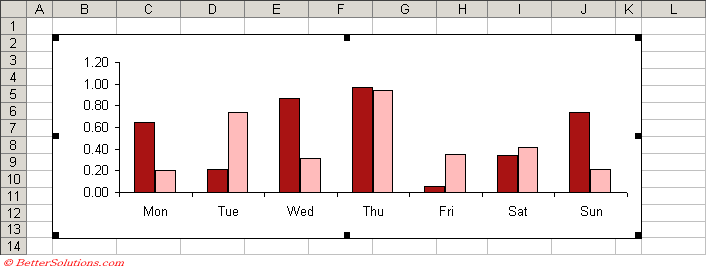 |
Resizing the Chart Object
You should see an outline of the chart move when you drag the mouse.
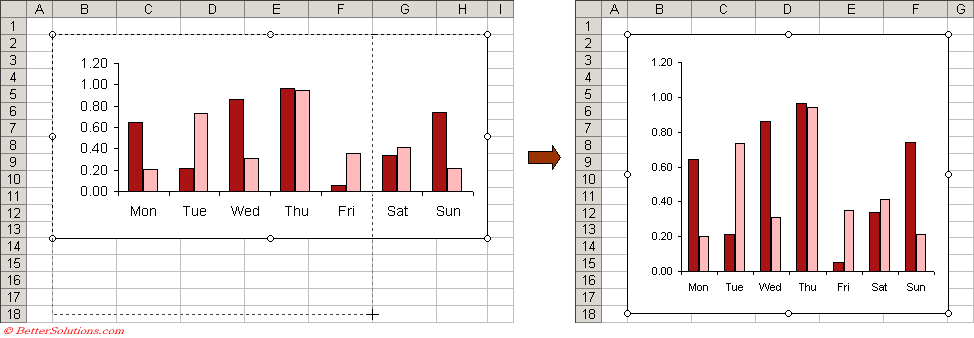 |
To size an object move the mouse pointer over the object and press the right mouse button ??
You can drag the sides using the handles ??
Resizing a Chart on a Chart Sheet
(View > Sized with Window)
This was removed in 2007.
Resizing Multiple Charts
It is possible to select multiple charts and drag a corner to resize them all.
Remember
To resize a chart in one dimension only (either height or width) drag one of the handles along that side.
To resize a chart on both dimensions drag one of the handles at the corner.
Finding
Home tab, Find & Select > Selection Pane
Location
You can keep your charts within the worksheet itself (embedded) or on a special standalone worksheet (called a chart sheet).
Embedded Chart - This will create the chart as an embedded object in the drawing layer of the worksheet.
Chart Sheet - This will create a chart on an additional sheet within the workbook.
You can easily switch between the two possible locations by selecting (Chart > Location).
An alternative to using the Chart drop-down menu you could also use the Chart shortcut menu.
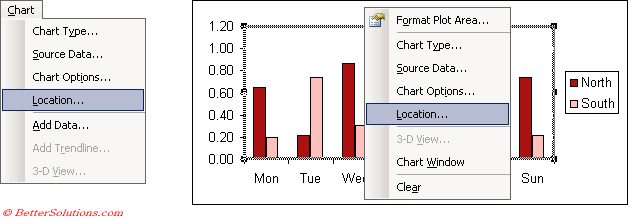 |
This will display the Chart Location dialog box.
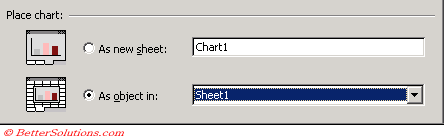 |
As new sheet - Inserts a new chart sheet before the active sheet.
As object in - This drop-down list includes all the worksheets and chart sheets in the active workbook. The chart sheet will be removed and the chart is moved to the selected worksheet.
If you choose to place your chart on a chart sheet you can enter the name of the chart sheet directly into the text box as opposed to renaming the sheet afterwards.
The location of a chart can be changed at any time by selecting (Chart > Location). This dialog box is identical to the last step of the Chart Wizard.
Embedded Charts
An embedded chart is placed in the worksheet's drawing layer and can often be treated like an object.
SS Include data in the screen shot
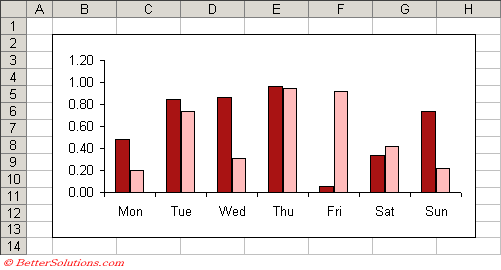 |
After you have created an embedded chart you can easily move it to a more suitable position on your worksheet.
These type of charts allow you to display the chart next to the data that is used.
Using embedded charts also lets you print the data next to the actual chart.
As with any other type of drawing object, embedded charts can be moved and resized on the worksheet.
It is also easier to see how the chart changes when the data changes.
Chart Sheets
It is possible to display several charts on a single chart sheet. Create your charts on a worksheet as usual.
These occupy an entire sheet and do not contain the data. This is the default.
This can be useful if you want to display the chart and the data separately.
When you choose (Chart > Location) you can use the drop-down list to move them to an existing chart sheet. Once the charts are there you can rearrange and size them ??
A chart sheet normally holds a single chart and is an optional way to display your charts. They make it slightly easier to work with and printing a chart on a page a bit easier, useful for presentations.
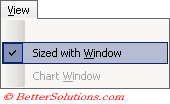
It is possible to resize a chart automatically according to the size of the window. Select (View > Sized with Window).
When this option is enabled the chart will resize automatically to fit the current window.
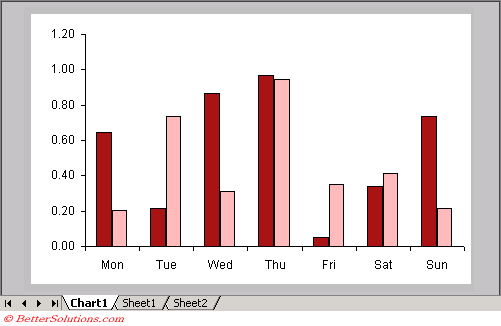
When a chart is created on a chart sheet the chart takes up the whole sheet.
You can adjust the size of a chart in a chart sheet by using the (View > Sized with Window).
 |
You can then adjust the size by adjusting the size of the window.
If the chart does not fit into the window then scroll bars will appear automatically.
 |
To add controls (combo boxes, command buttons etc) to a chart sheet, use the Forms toolbar and not the Controls toolbar).
It is possible for a chart sheet to contain more than one chart. You can move an embedded chart to an existing chart sheet.
You can delete a chart sheet exactly the same as you would delete a normal worksheet.
Multiple Charts on Chart Sheets
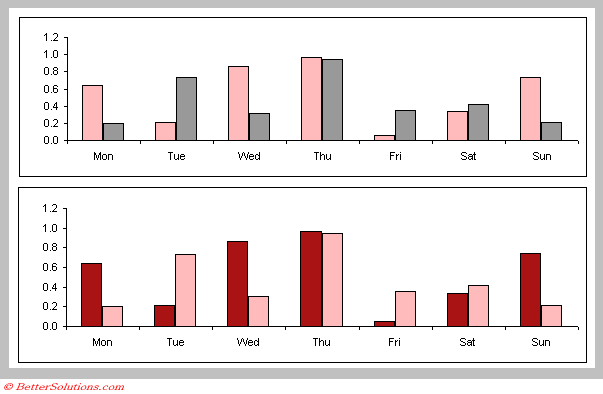
It is possible to have multiple charts displayed on a single chart sheet.
Activate the embedded chart you want to move and select (Chart > Location)
When you specify the "as new sheet" option you can type the name of an existing chart sheet.
Pressing OK will display a confirmation dialog box. Press OK
This new chart can then be repositioned and resized accordingly.
 |
Remember
Using chart sheets can often make it easier to find a particular chart as each chart sheet can be given a descriptive name.
If you have put multiple charts on the same chart sheet you can only modify one at a time.
Printing Embedded Charts
You can print a chart by itself, by selecting the chart and pressing (File > Print).
If you want to print the area around a chart then select the cell range surrounding the chart before pressing (File > Print).
When you have a chart sheet selected you will see a Chart specific tab in the (File > Page Setup) dialog box.
You can specify where on the page you want the chart printed and charts can be moved and resized using Page Break View.
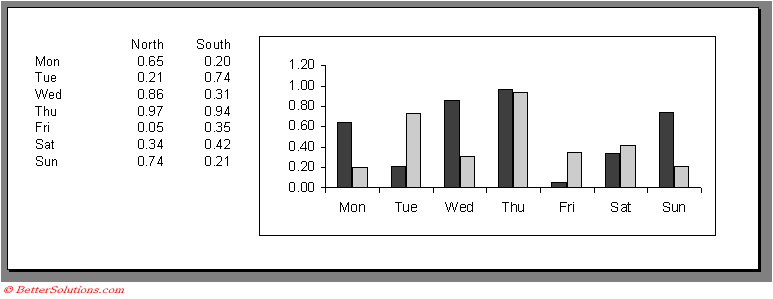
Selecting the range of cells which are behind an embedded chart will include the chart
 |
If you want to print charts on separate pages then you might find it easier to use a Chart sheet rather than an embedded chart.
To print an embedded chart on its own page just select the chart object and select (File > Print) or press the print button the standard toolbar. The chart is scaled to the full printable area of the page.
Printing embedded charts is very simple as you just need to select the cell range behind the chart. If a chart is selected while you press (File > Print) then only the chart will be printed.
You can prevent a chart from being printed by changing the Print Object checkbox. Right mouse click the chart and select (Format Chart Area)(Properties tab).
Any chart sheets are printed one to a page.
If you select a chart and press Print, Excel prints the chart on a page by itself and will not print any of the worksheet.
Embedded charts can often span multiple pages so you should always check your print preview before printing several embedded charts.
Printing Chart Sheets
If you have a chart or chart sheet selected then using the Print button on the standard toolbar will print the entire chart.
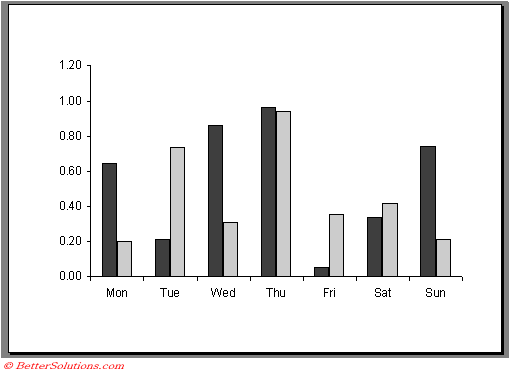 |
Does the Zoom % affect the size on the printout
If your chart is on a separate chart sheet you have a bit more control over how the chart will be prinited.
Chart sheets are always printed on a single page.
Page Setup - Chart Tab
Selecting (File > Page Setup) will display a Chart tab which included a number of chart specific options.
This tab replaces the Sheet tab when you have a chart sheet activated.
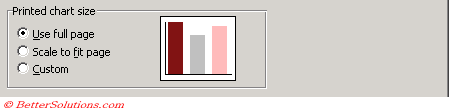 |
Use full page - This is the default and will print the chart to a full height and width on the page. This option can however distort the chart.
Scale to fit page - This will expand your chart to fit the page but will keep the original proportions. This option will not distort your chart and gives the best results.
Custom - This will print the chart exactly as it appears on the screen. The chart will print at the current window size and with the those exact proportions. You can adjust the size of the chart using the mouse when you return to the chart sheet.
 |
Draft quality - This will print your chart sheets with a reduced amount of formatting.
Print in black and white - This should be used when you don't want to print colour from your colour printer.
Exclude Embedded Charts
If an embedded chart is selected when you press Print the prinout will only contain the chart.
If you do not want a chart to be included when you print out a worksheet you can exclude it.
Right click on the chart and select (Format Chart Area).
Select the Properties tab and remove the check again "Print Object"
SS
Remember
If a chart is selected then only that chart will be printed.
When you print a chart on its own page, the chart will expand to fit the page. The printed chart may look different from the chart on the worksheet.
© 2026 Better Solutions Limited. All Rights Reserved. © 2026 Better Solutions Limited TopPrevNext