Data Source
There are four ways you can display the source data for a chart.
1) Displaying the Select Data dialog box.
2) Using the Chart Range Indicator you can quickly see which range of cells an embedded chart is referring to.
3) Seleting an individual series and editing the Series Formula.
The quickest way to selected stuff is to use the Layout tab at the top
Select Data Source dialog box
Add - Displays the Edit Series dialog box explained below allowing you to select the data from a new series
Edit - Displays the Edit Series dialog box explained below
Remove - Removes the series which is currently selected
Hidden and Empty Cells -
Edit Series dialog box
Lets you change the Series name and the Series values
Chart Tools, Design Tab
When you activate a chart the contextual Chart Tools tabs are automatically displayed.
You can display the source data for the active chart by activating the chart and selecting Select Data.
This will display the Select Data dialog box.
SS - Select Data
Using the Chart Shortcut Menu
The easiest way to adjust the source data of a chart is to right mouse click and select "Source Data" and click on the series tab.
You can select either the chart area or the plot area to display this shortcut menu.
SS - plot area shortcut menu
Using the (Chart > Source Data) dialog box
Displaying the (Chart > Source Data) dialog box gives you much greater control over the indidiual series on your chart.
You can modify the range reference on the Data Range tab to adjust the data range for the whole chart.
The Data range textbox displays the range of cells which is being used for the source data.
If you originally selected a single cell, then this will have been automatically expanded to the current region.
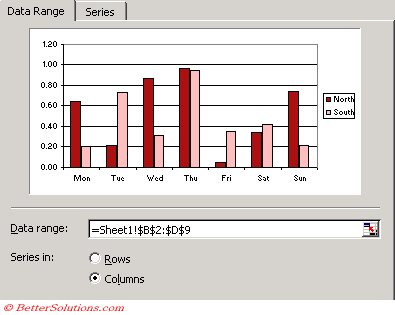 |
Data range - You can edit the cell range manually or you can use the mouse to highlight a different range. Using the arrow keys while in this box will actually select cells instead of moving your position within the box.
Rows - Plots the data series of the chart using each row as a separate series.
Columns - Plots the data series of the chart using each column as a separate series.
You can modify the range references for the individual series using the Series tab of this dialog box.
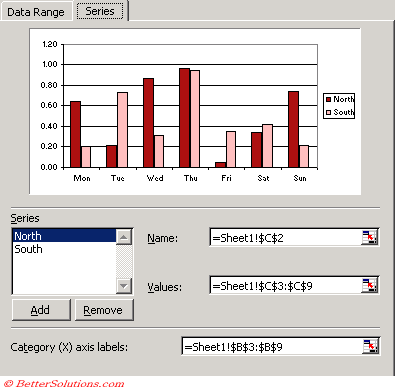 |
Series - The series list displays the names of all the data series on the chart. Selecting a particular series will display the corresponding Name and Values.
Add - Adds a new data series to the active chart.
Remove - Removes the currently selected series from the active chart.
Name - This is used in the Legend to identify the series.
Values - These are the data series values.
Category (X) axis labels - These are chart specifc and not series specific. If there is no category axis labels provided then a list of sequential numbers will be used.
Your source data can use named ranges instead of direct cell references
Important
The Automatic Range Finder can only be used with embedded charts when the chart is on th same worksheet as the data.
If you delete the source data for a chart and press F9 your source data will contain #REF's and will have to be re-defined.
Source Data in hidden rows is not shown by default but you can change the setting (Tools > Options)(Chart tab, "Plot Visible cells only").
It can sometimes be easier to overwrite the series name which will typically be a cell reference just to a hard types string constant contained in double quotes.
If a whole chart is selected then the "Data Range" tab will be displayed by default when you display the Source Data dialog box.
If an individual series is selected then the "Series" tab will be displayed by default when you display the Source Data dialog box.
© 2026 Better Solutions Limited. All Rights Reserved. © 2026 Better Solutions Limited TopPrevNext