Funnel
Added in 2019.
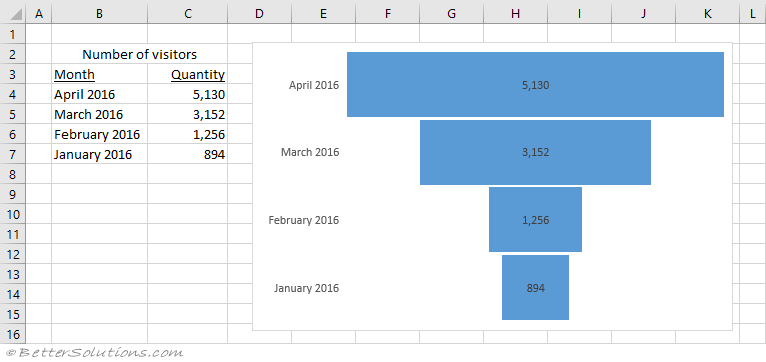
A funnel chart can be used to provide a visual picture of the different stages in a process.
This feature is only available in Excel for Windows if you have Office 2019, or if you have a Microsoft 365 subscription.
link - support.microsoft.com/en-us/office/create-a-funnel-chart-ba21bcba-f325-4d9f-93df-97074589a70e
A funnel chart can be used to represent different stages in a process showing progressively decreasing proportions.
 |
© 2026 Better Solutions Limited. All Rights Reserved. © 2026 Better Solutions Limited TopPrevNext