Bubble
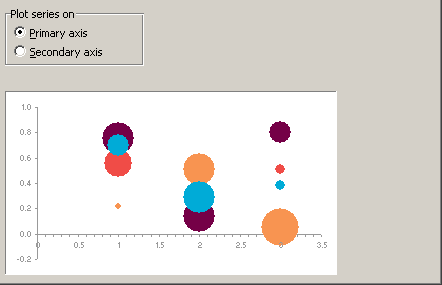
Bubble Series Options
Series Options
SS
Plot series on primary axis -
Plot series on secondary axis -
Size represents area of bubbles -
Size represents width of bubbles -
Scale bubble size to -
Show negative bubbles -
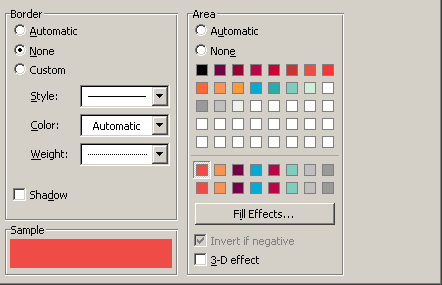
Fill & Line
SS - Fill
No fill - Makes the series transparent with no fill colour Solid fill - Color, Transparency Gradient fill - Preset gradients, Type, Direction, Angle, Gradient Stops, Color, Position, Transparency, Brightness, Rotate with shape.
Picture or texture fill - Insert picture from file, Insert picture from clipboard, Insert picture from online, Texture, Transparency, Tile picture as
texture, Offset x, Offset y, Scale x, Scale y, Alignment, Mirror type, Rotate with shape.
Pattern fill - Pattern, Foreground, Background Automatic - Color
SS - Border
No line - No border line is displayed
Solid line - Color, Transparency, Width, Compound type, Dash type, Cap type, Join type. Smoothed line. The four Arrow options are never enabled for
column charts.
Gradient line - Preset gradients, Type, Direction, Angle, Gradient stops, Color, Position, Transparency, Brightness, Width, Compound type, Dash type,
Cap type, Join type, Smoothed line. The four Arrow options are never enabled for column charts.
Automatic - Color, Transparency, Width, Compound type, Dash type, Cap type, Join type, Smoothed line. rection, Angle, Gradient stops, Color, Position,
Transparency, Brightness, Width, Compound type, Dash type, Cap type, Join type, Smoothed line. The four Arrow options are never enabled for column
charts.
Effects
SS
Refer to the Page - Chart Formatting > Effects
A bubble chart requires an additional set of data to define the size of the bubbles.
Compares sets of 3 values. Similar to a scatter but with a third value displayed by the bubble size
Series Options
Plot series on primary axis -
Plot series on secondary axis -
Size represents area of bubbles -
Size represents width of bubbles -
Scale bubble size to -
Show negative bubbles -
Edit Series
Series Name -
Series X Values -
Series Y Values -
Series Bubble Size -
Edit Axis Labels
not editable
Patterns
 |
Axis
 |
X Error Bars
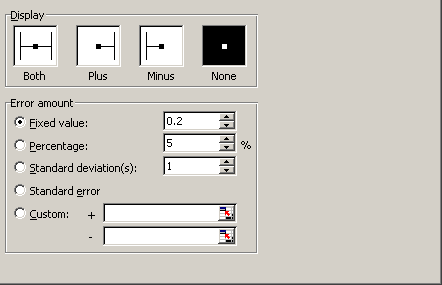 |
Y Error Bars
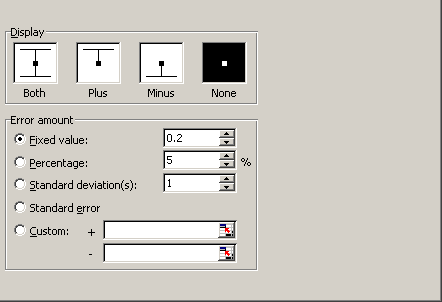 |
Data Labels
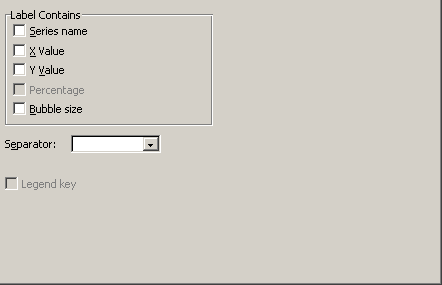 |
Series Order
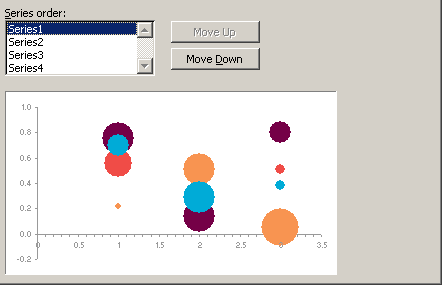 |
Options
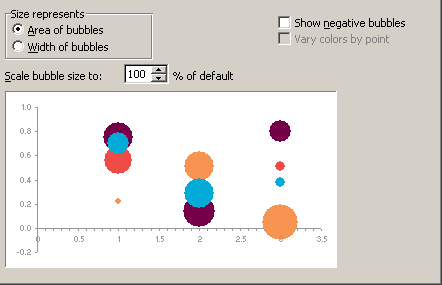 |
Size represents -
Scale bubble size to % of default -
Show negative bubbles -
Vary colors by point -
3D Options
same as above
© 2026 Better Solutions Limited. All Rights Reserved. © 2026 Better Solutions Limited TopPrevNext