Sampling
Statistical analysis is often done on a sample and not a whole population.
Periodic -
Random -
Using Sampling
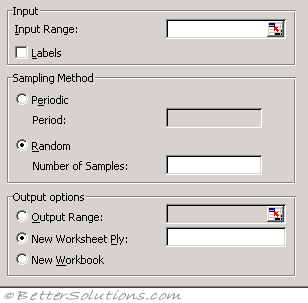 |
This dialog box takes an input of the source population data and where the sample should be placed
Input Range - Enter the references for the range of data that contains the population of values you want to sample. Microsoft Excel draws samples from the first column, then the second column, and so on.
Labels - Select if the first row or column of your input range contains labels. Clear if your input range has no labels; Excel generates appropriate data labels for the output table.
Sampling Method - Click Periodic or Random to indicate the sampling interval you want.
Period - Enter the periodic interval at which you want sampling to take place. The period-th value in the input range and every period-th value thereafter is copied to the output column. Sampling stops when the end of the input range is reached.
Number of Samples - Enter the number of random values you want in the output column. Each value is drawn from a random position in the input range, and any number can be selected more than once.
Output Range - Enter the reference for the upper-left cell of the output table. Data is written in a single column below the cell. If you select Periodic, the number of values in the output table is equal to the number of values in the input range, divided by the sampling rate. If you select Random, the number of values in the output table is equal to the number of samples.
New Worksheet Ply - Click to insert a new worksheet in the current workbook and paste the results starting at cell A1 of the new worksheet. To name the new worksheet, type a name in the box.
New Workbook - Click to create a new workbook and paste the results on a new worksheet in the new workbook.
The Sampling analysis tool creates a sample from a population by treating the input range as a population. When the population is too large to process or chart, you can use a representative sample. You can also create a sample that contains only values from a particular part of a cycle if you believe that the input data is periodic.
For example, if the input range contains quarterly sales figures, sampling with a periodic rate of four places values from the same quarter in the output range.
© 2026 Better Solutions Limited. All Rights Reserved. © 2026 Better Solutions Limited TopPrevNext